Global Ski & Snowboard Wax Market 2024 - Industry Analysis by Player, Region, Type, Application and Sales Channel, Forecast
The global Ski & Snowboard Wax Market size reached 231 USD Million in 2023. Looking forward, MarketsGlob expects the market to reach 295 USD Million by 2031, exhibiting a growth rate (CAGR) of 3.1% during 2024-2031.
Ski & Snowboard Wax Market
Market forecast to grow at a CAGR of 3.1%
![Ski & Snowboard Wax Market](https://marketsglob.com/wp-content/uploads/2024/01/Ski-Snowboard-Wax-Market-min.png)
Note:The image is for illustrative purposes only
Scope of Report
This report studies the Ski & Snowboard Wax market, covering market size for segment by type (Glide Waxes, Grip Waxes, etc), by application (Skis, Snowboards, etc), by sales channel (Direct Channel, Distribution Channel), by players (Datawax, Darent Wax, TOKO Wax & Care, Start Ski Wax, Nanox, etc) and by region (North America, Europe, Asia-Pacific, Latin America, Middle East and Africa).
This report provides detailed historical analysis of global market for Ski & Snowboard Wax from 2018-2023, and provides extensive market forecasts from 2024-2031 by region/country and subsectors. It covers the sales/revenue/value, gross margin, historical growth and future perspectives in the Ski & Snowboard Wax market.
![Ski & Snowboard Wax Status & Outlook](https://marketsglob.com/infographics/202402/Ski & Snowboard Wax Market-2.png)
Manufacturers Segment Analysis
- Datawax
- Darent Wax
- TOKO Wax & Care
- Start Ski Wax
- Nanox
- Hertel Ski Wax
- Swix
- ZumWax
- Demon United
- Maxiglide Products
- DaKine
- Fast Wax
- Burton Snowboards
- Purl Wax
- Rex
- Boardside Down Wax
Products Segment Analysis
- Glide Waxes
- Grip Waxes
Applications Segment Analysis
- Skis
- Snowboards
Sales Channel Segment Analysis
- Direct Channel
- Distribution Channel
Market segment by Region/Country including:
- North America (United States, Canada, Mexico)
- Europe (Germany, United Kingdom, France, Italy, Russia, Spain, Benelux, Poland, Austria, Portugal, Rest of Europe)
- Asia-Pacific (China, Japan, Korea, India, Southeast Asia, Australia, Taiwan, Rest of Asia Pacific)
- South America (Brazil, Argentina, Colombia, Chile, Peru, Venezuela, Rest of South America)
- Middle East & Africa (UAE, Saudi Arabia, South Africa, Egypt, Nigeria, Rest of Middle East & Africa)
![Ski & Snowboard Wax Share by Product Types & Application](https://marketsglob.com/infographics/202402/Ski & Snowboard Wax Market.png)
Report Coverage:
Base Year of the Analysis | 2023 |
---|---|
Historical Period | 2018-2023 |
Forecast Period | 2024-2031 |
Types Covered | Glide Waxes, Grip Waxes |
Applications Covered | Skis, Snowboards |
Sales Channels Covered | Direct Channel, Distribution Channel |
Regions Covered | North America, Europe, Asia-Pacific, South America, Middle East and Africa |
Countries Covered | United States, Canada, Mexico, Germany, United Kingdom, France, Italy, Russia, Spain, Benelux, Poland, Austria, Portugal, Rest of Europe, China, Japan, Korea, India, Southeast Asia, Australia, Taiwan, Rest of Asia Pacific, Brazil, Argentina, Colombia, Chile, Peru, Venezuela, Rest of South America, UAE, Saudi Arabia, South Africa, Egypt, Nigeria, Rest of Middle East & Africa |
Companies Covered | Datawax, Darent Wax, TOKO Wax & Care, Start Ski Wax, Nanox, Hertel Ski Wax, Swix, ZumWax, Demon United, Maxiglide Products, DaKine, Fast Wax, Burton Snowboards, Purl Wax, Rex, Boardside Down Wax |
Customization Scope | We offer extensive customization options for different segments at the region/country-level, ensuring that specific needs are met. Furthermore, our services extend to additional customization based on your unique requirements. |
Purchase Options | We have three plans to opt for: Standard Plan (PDF), Advanced Plan (PDF + Excel Data Pack) & Extended Plan (PDF + Excel Data Pack + Periodic Update). For more details, please check details of plan types & features. |
Chapter 1 Ski & Snowboard Wax Market Overview
1.1 Ski & Snowboard Wax Definition
1.2 Global Ski & Snowboard Wax Market Size Status and Outlook (2018-2031)
1.3 Global Ski & Snowboard Wax Market Size Comparison by Region (2018-2031)
1.4 Global Ski & Snowboard Wax Market Size Comparison by Type (2018-2031)
1.5 Global Ski & Snowboard Wax Market Size Comparison by Application (2018-2031)
1.6 Global Ski & Snowboard Wax Market Size Comparison by Sales Channel (2018-2031)
1.7 Ski & Snowboard Wax Market Dynamics
1.7.1 Market Drivers/Opportunities
1.7.2 Market Challenges/Risks
1.7.3 Market News (Products Launch, Mergers, Acquisitions, Expansion, Agreement and Collaborations, Partnerships)
1.7.4 COVID-19 Impacts
1.7.5 Russia-Ukraine War Impacts
Chapter 2 Executive Summary
2.1 Global Ski & Snowboard Wax Market Snapshot
2.2 Global Ski & Snowboard Wax Market Volume & Revenue 2018-2023
2.3 Global Ski & Snowboard Wax Market Differential Growth Potential Analysis by Type, 2018-2031 (USD Million)
2.4 Global Ski & Snowboard Wax Market Differential Growth Potential Analysis by Application, 2018-2031 (USD Million)
2.5 Global Ski & Snowboard Wax Market Differential Growth Potential Analysis by Sales Channels, 2018-2031 (USD Million)
2.6 Global Ski & Snowboard Wax Market Differential Growth Potential Analysis by Region, 2018-2031 (USD Million)
Chapter 3 Ski & Snowboard Wax Market Segment Analysis by Player
3.1 Global Ski & Snowboard Wax Sales and Market Share by Player (2021-2023)
3.2 Global Ski & Snowboard Wax Revenue and Market Share by Player (2021-2023)
3.3 Global Ski & Snowboard Wax Average Price by Player (2021-2023)
3.4 Players Competition Situation & Trends (2021-2023)
3.5 Conclusion of Segment by Player
Chapter 4 Ski & Snowboard Wax Market Segment Analysis by Type
4.1 Global Ski & Snowboard Wax Market by Type
4.1.1 Glide Waxes
4.1.2 Grip Waxes
4.2 Global Ski & Snowboard Wax Sales and Market Share by Type (2018-2023)
4.3 Global Ski & Snowboard Wax Revenue and Market Share by Type (2018-2023)
4.4 Global Ski & Snowboard Wax Average Price by Type (2018-2023)
4.5 Leading Players of Ski & Snowboard Wax by Type in 2023
4.6 Conclusion of Segment by Type
Chapter 5 Ski & Snowboard Wax Market Segment Analysis by Application
5.1 Global Ski & Snowboard Wax Market by Application
5.1.1 Skis
5.1.2 Snowboards
5.2 Global Ski & Snowboard Wax Revenue and Market Share by Application (2018-2023)
5.3 Leading Consumers of Ski & Snowboard Wax by Application in 2023
5.4 Conclusion of Segment by Application
Chapter 6 Ski & Snowboard Wax Market Segment Analysis by Sales Channel
6.1 Global Ski & Snowboard Wax Market by Sales Channel
6.1.1 Global Ski & Snowboard Wax Market, by Direct Channel Market Analysis 2018-2031 (USD Million)
6.1.2 Global Ski & Snowboard Wax Market, by Distribution Channel Market Analysis 2018-2031 (USD Million)
6.2 Global Ski & Snowboard Wax Revenue and Market Share by Sales Channel (2018-2023)
6.3 Leading Distributors/Dealers of Ski & Snowboard Wax by Sales Channel in 2023
6.4 Conclusion of Segment by Sales Channel
Chapter 7 Ski & Snowboard Wax Market Segment Analysis by Region
7.1 Global Ski & Snowboard Wax Market Size and CAGR by Region (2018-2031)
7.2 Global Ski & Snowboard Wax Sales and Market Share by Region (2018-2023)
7.3 Global Ski & Snowboard Wax Revenue and Market Share by Region (2018-2023)
7.4 North America
7.4.1 North America Market by Country
7.4.2 North America Ski & Snowboard Wax Market Share by Type
7.4.3 North America Ski & Snowboard Wax Market Share by Application
7.4.4 United States
7.4.5 Canada
7.4.6 Mexico
7.5 Europe
7.5.1 Europe Market by Country
7.5.2 Europe Ski & Snowboard Wax Market Share by Type
7.5.3 Europe Ski & Snowboard Wax Market Share by Application
7.5.4 Germany
7.5.5 United Kingdom
7.5.6 France
7.5.7 Italy
7.5.8 Russia
7.5.9 Spain
7.5.10 Benelux
7.5.11 Poland
7.5.12 Austria
7.5.13 Portugal
7.5.14 Rest of Europe
7.6 Asia-Pacific
7.6.1 Asia-Pacific Market by Country
7.6.2 Asia-Pacific Ski & Snowboard Wax Market Share by Type
7.6.3 Asia-Pacific Ski & Snowboard Wax Market Share by Application
7.6.4 China
7.6.5 Japan
7.6.6 Korea
7.6.7 India
7.6.8 Southeast Asia
7.6.9 Australia
7.6.10 Taiwan
7.6.11 Rest of Asia Pacific
7.7 South America
7.7.1 South America Market by Country
7.7.2 South America Ski & Snowboard Wax Market Share by Type
7.7.3 South America Ski & Snowboard Wax Market Share by Application
7.7.4 Brazil
7.7.5 Argentina
7.7.6 Colombia
7.7.7 Chile
7.7.8 Peru
7.7.9 Venezuela
7.7.10 Rest of South America
7.8 Middle East & Africa
7.8.1 Middle East & Africa Market by Country
7.8.2 Middle East & Africa Ski & Snowboard Wax Market Share by Type
7.8.3 Middle East & Africa Ski & Snowboard Wax Market Share by Application
7.8.4 UAE
7.8.5 Saudi Arabia
7.8.6 South Africa
7.8.7 Egypt
7.8.8 Nigeria
7.8.9 Rest of Middle East & Africa
7.9 Conclusion of Segment by Region
Chapter 8 Profile of Leading Ski & Snowboard Wax Players
8.1 Datawax
8.1.1 Company Snapshot
8.1.2 Product/Service Offered
8.1.3 Business Performance (Sales, Price, Revenue, Gross Margin and Market Share)
8.1.4 Recent Developments
8.2 Darent Wax
8.2.1 Company Snapshot
8.2.2 Product/Service Offered
8.2.3 Business Performance (Sales, Price, Revenue, Gross Margin and Market Share)
8.2.4 Recent Developments
8.3 TOKO Wax & Care
8.3.1 Company Snapshot
8.3.2 Product/Service Offered
8.3.3 Business Performance (Sales, Price, Revenue, Gross Margin and Market Share)
8.3.4 Recent Developments
8.4 Start Ski Wax
8.4.1 Company Snapshot
8.4.2 Product/Service Offered
8.4.3 Business Performance (Sales, Price, Revenue, Gross Margin and Market Share)
8.4.4 Recent Developments
8.5 Nanox
8.5.1 Company Snapshot
8.5.2 Product/Service Offered
8.5.3 Business Performance (Sales, Price, Revenue, Gross Margin and Market Share)
8.5.4 Recent Developments
8.6 Hertel Ski Wax
8.6.1 Company Snapshot
8.6.2 Product/Service Offered
8.6.3 Business Performance (Sales, Price, Revenue, Gross Margin and Market Share)
8.6.4 Recent Developments
8.7 Swix
8.7.1 Company Snapshot
8.7.2 Product/Service Offered
8.7.3 Business Performance (Sales, Price, Revenue, Gross Margin and Market Share)
8.7.4 Recent Developments
8.8 ZumWax
8.8.1 Company Snapshot
8.8.2 Product/Service Offered
8.8.3 Business Performance (Sales, Price, Revenue, Gross Margin and Market Share)
8.8.4 Recent Developments
8.9 Demon United
8.9.1 Company Snapshot
8.9.2 Product/Service Offered
8.9.3 Business Performance (Sales, Price, Revenue, Gross Margin and Market Share)
8.9.4 Recent Developments
8.10 Maxiglide Products
8.10.1 Company Snapshot
8.10.2 Product/Service Offered
8.10.3 Business Performance (Sales, Price, Revenue, Gross Margin and Market Share)
8.10.4 Recent Developments
8.11 DaKine
8.11.1 Company Snapshot
8.11.2 Product/Service Offered
8.11.3 Business Performance (Sales, Price, Revenue, Gross Margin and Market Share)
8.11.4 Recent Developments
8.12 Fast Wax
8.12.1 Company Snapshot
8.12.2 Product/Service Offered
8.12.3 Business Performance (Sales, Price, Revenue, Gross Margin and Market Share)
8.12.4 Recent Developments
8.13 Burton Snowboards
8.13.1 Company Snapshot
8.13.2 Product/Service Offered
8.13.3 Business Performance (Sales, Price, Revenue, Gross Margin and Market Share)
8.13.4 Recent Developments
8.14 Purl Wax
8.14.1 Company Snapshot
8.14.2 Product/Service Offered
8.14.3 Business Performance (Sales, Price, Revenue, Gross Margin and Market Share)
8.14.4 Recent Developments
8.15 Rex
8.15.1 Company Snapshot
8.15.2 Product/Service Offered
8.15.3 Business Performance (Sales, Price, Revenue, Gross Margin and Market Share)
8.15.4 Recent Developments
8.16 Boardside Down Wax
8.16.1 Company Snapshot
8.16.2 Product/Service Offered
8.16.3 Business Performance (Sales, Price, Revenue, Gross Margin and Market Share)
8.16.4 Recent Developments
Chapter 9 Upstream and Downstream Analysis of Ski & Snowboard Wax
9.1 Industrial Chain of Ski & Snowboard Wax
9.2 Upstream of Ski & Snowboard Wax
9.2.1 Raw Materials (If Applicable)
9.2.2 Manufacturing Cost Structure (If Applicable)
9.2.3 Manufacturing Process (If Applicable)
9.3 Downstream of Ski & Snowboard Wax
9.3.1 Leading Distributors/Dealers of Ski & Snowboard Wax
9.3.2 Leading Consumers of Ski & Snowboard Wax
Chapter 10. Global Ski & Snowboard Wax Market Industry Analysis
10.1. Porter's Five Forces Analysis
10.1.1. Threat of New Entrants
10.1.2. Bargaining Power of Buyers/Consumers
10.1.3. Bargaining Power of Suppliers
10.1.4. Threat of Substitute Types
10.1.5. Intensity of Competitive Rivalry
10.2. Major Growth Avenues within Global Ski & Snowboard Wax Market
10.2.1. Product Types
10.2.2. Applications
10.2.3. Sales Channels
10.2.4. Country
10.3. Ski & Snowboard Wax Industry Ecosystem
10.4. Price Trend Analysis (If Applicable)
10.5. Buying Criteria (If Applicable)
10.6. Regulations (If Applicable)
Chapter 11 Development Trend of Ski & Snowboard Wax (2024-2031)
11.1 Global Ski & Snowboard Wax Market Size (Sales and Revenue) Forecast (2024-2031)
11.2 Global Ski & Snowboard Wax Market Size and CAGR Forecast by Region (2024-2031)
11.3 Global Ski & Snowboard Wax Market Size and CAGR Forecast by Type (2024-2031)
11.4 Global Ski & Snowboard Wax Market Size and CAGR Forecast by Application (2024-2031)
11.5 Global Ski & Snowboard Wax Market Size and CAGR Forecast by Sales Channel (2024-2031)
Chapter 12. Import - Export Analysis (If Applicable)
12.1 North America Ski & Snowboard Wax Import-Export, 2018-2023
12.2 Europe Ski & Snowboard Wax Import-Export, 2018-2023
12.3 Asia Pacific Ski & Snowboard Wax Import-Export, 2018-2023
12.4 South America Ski & Snowboard Wax Import-Export, 2018-2023
12.5 Middle East & Africa Ski & Snowboard Wax Import-Export, 2018-2023
Chapter 13. Demand-Supply Gap Analysis
13.1 North America Ski & Snowboard Wax Demand-Supply, 2018-2023
13.2 Europe Ski & Snowboard Wax Demand-Supply, 2018-2023
13.3 Asia Pacific Ski & Snowboard Wax Demand-Supply, 2018-2023
13.4 South America Ski & Snowboard Wax Demand-Supply, 2018-2023
13.5 Middle East & Africa Ski & Snowboard Wax Demand-Supply, 2018-2023
Chapter 14 Appendix
14.1 Research Methodology
14.2 Data Sources
- Methodology/Research Approach
The research study involved the extensive usage of both primary and secondary data sources. The research process involved the study of various factors affecting the industry, including the government policy, market environment, competitive landscape, historical data, present trends in the market, technological innovation, upcoming technologies and the technical progress in related industry, and market risks, opportunities, market barriers and challenges. The following illustrative figure shows the market research methodology applied in this report.
Research Programs/Design
Table Research Programs/Design
![research-designs](/wp-content/uploads/2024/01/Research-Design-2024-marketsglob-min.png)
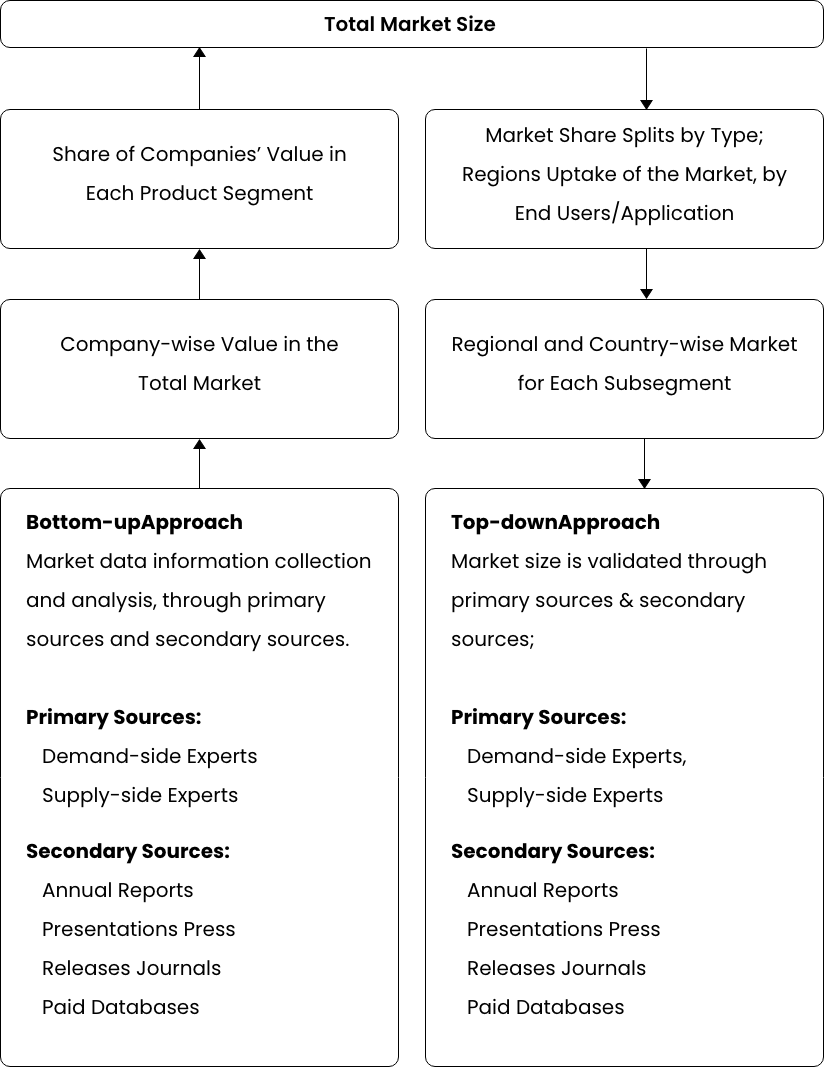
Market Size Estimation
Top-down and bottom-up approaches are used to validate the global product market size and estimate the market size for company, regions segments, product segments and application (end users).
The market estimations in this report are based on the marketed sale price of product (excluding any discounts provided by the manufacturer, distributor, wholesaler or traders). The percentage splits, market share, and breakdown of the product segments are derived on the basis of weightages assigned to each of the segments on the basis of their utilization rate and average sale price. The regional splits of the overall product market and its sub-segments are based on the percentage adoption or utilization of the given product in the respective region or country.
Major companies from the market are identified through secondary research and their market revenues determined through primary and secondary research. Secondary research included the research of the annual and financial reports of the top companies; whereas, primary research included extensive interviews of key opinion leaders and industry experts such as experienced frontline staff, directors, CEOs and marketing executives. The percentage splits, market share, growth Rate and breakdown of the product markets are determined through using secondary sources and verified through the primary sources.
All possible factors that influence the markets included in this research study have been accounted for, viewed in extensive detail, verified through primary research, and analyzed to get the final quantitative and qualitative data. The market size for top-level markets and sub-segments is normalized, and the effect of inflation, economic downturns, and regulatory & policy changes or other factors are not accounted for in the market forecast. This data is combined and added with detailed inputs and analysis from research and presented in the report
The following figure shows an illustrative representation of the overall market size estimation processused for this study.
Figure Bottom-up and Top-down approaches
![Bottom-up and Top-down approaches](/wp-content/uploads/2023/04/Total-Market-Size-min.png)
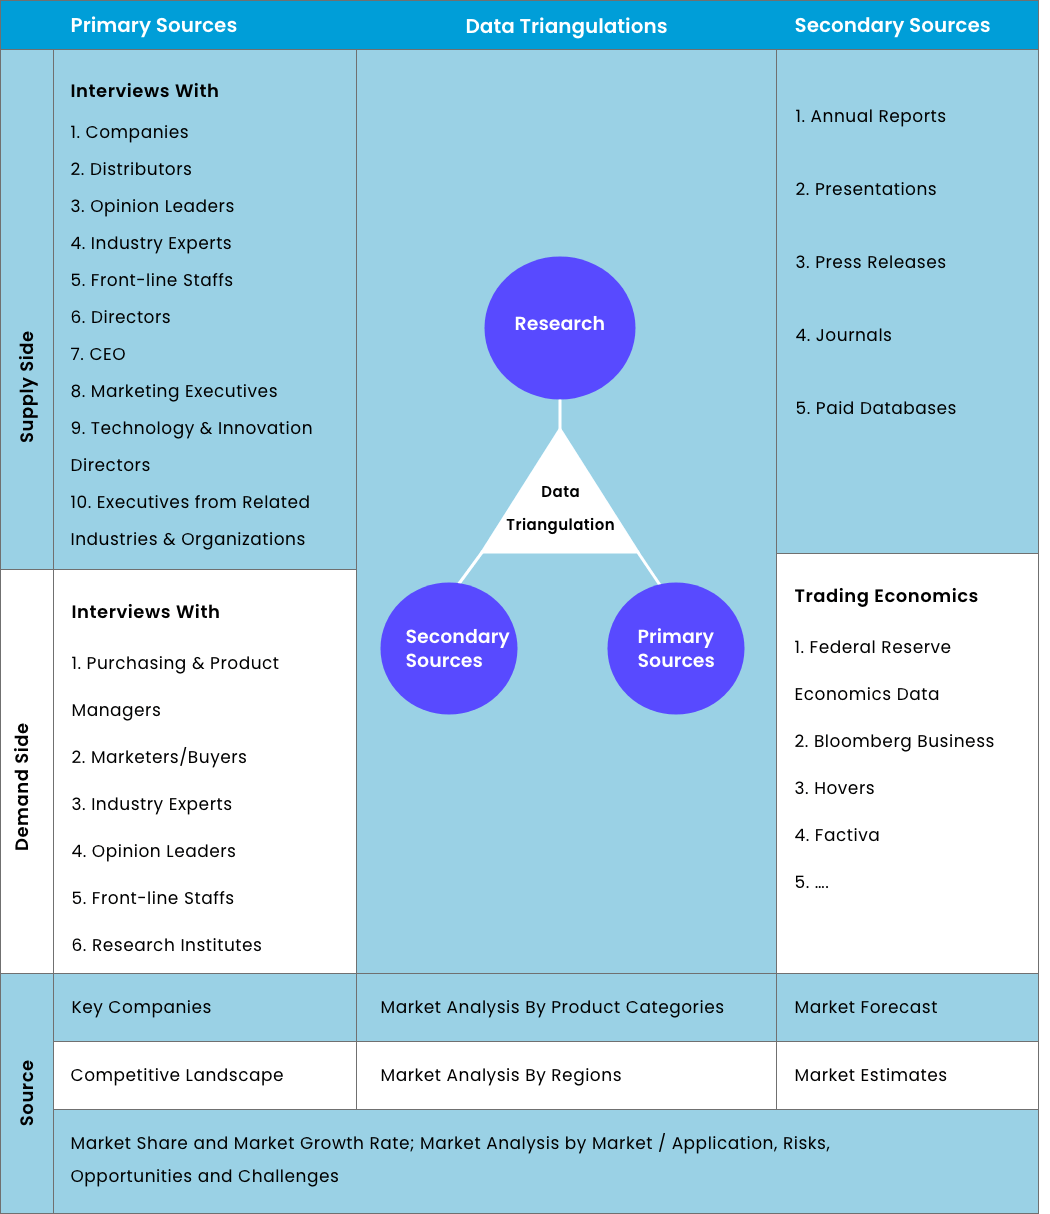
Market Breakdown and Data Triangulation
After complete market engineering with calculations for market statistics; market size estimations; market forecasting; market breakdown; and data triangulation, extensive primary research was conducted to gather information and verify and validate the critical numbers arrived at. In the complete market engineering process, both top-down and bottom-up approaches were extensively used, along with several data triangulation methods, to perform market estimation and market forecasting for the overall market segments and sub segments listed in this report. Extensive qualitative and further quantitative analysis is also done from all the numbers arrived at in the complete market engineering process to list key information throughout the report.
Figure Data Triangulation
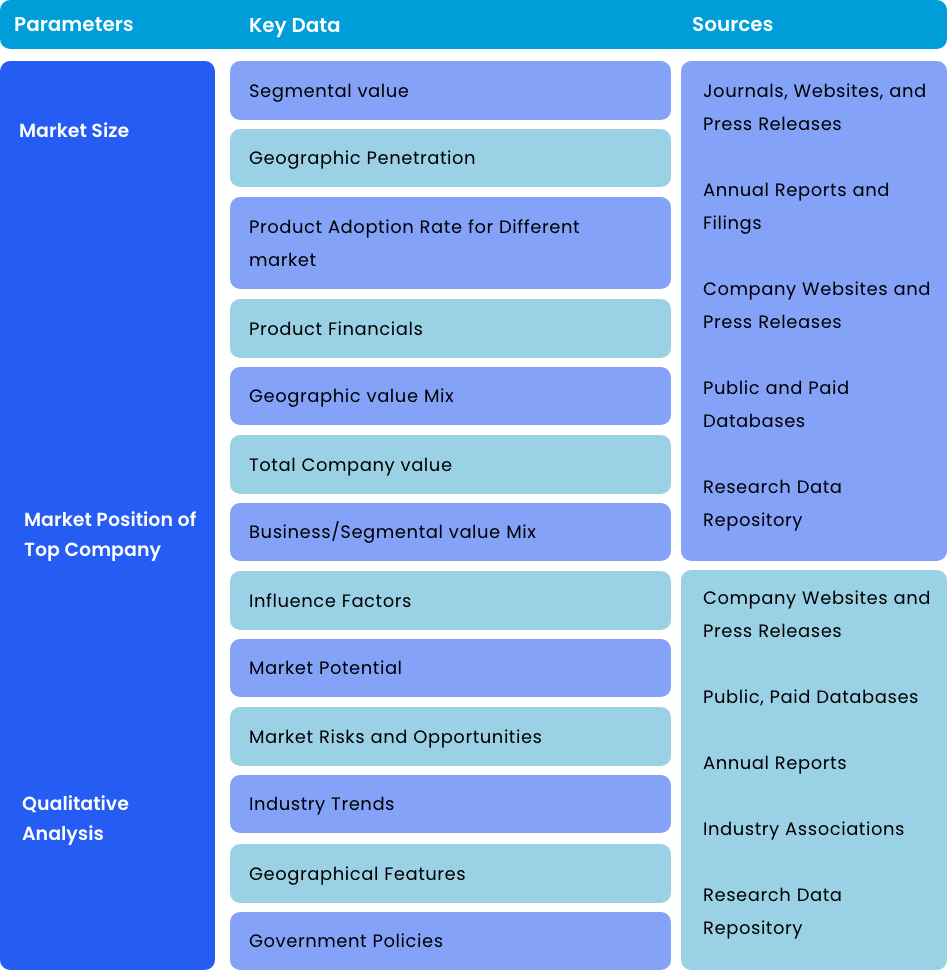
![Data Triangulation](/wp-content/uploads/2023/04/Data-Triangulations-min.png)
- Data Source
Secondary Sources
Secondary sources include such as press releases, annual reports, non-profit organizations, industry associations, governmental agencies and customs data etc. This research study involves the usage of widespread secondary sources, directories, databases such as Bloomberg Business, Wind Info, Hoovers, Factiva (Dow Jones & Company), and TRADING ECONOMICS, and News Network, Statista, Federal Reserve Economic Data, annual reports, BIS Statistics, ICIS; company house documents; CAS (American Chemical Society); investor presentations; and SEC filings of companies. Secondary research was used to identify and collect information useful for the extensive, technical, marketoriented, and commercial study of the Product market. It was also used to obtain important information about the top companies, market classification and segmentation according to industry trends to the bottom-most level, and key developments related to market and technology perspectives.
Table Key Data Information from Secondary Sources
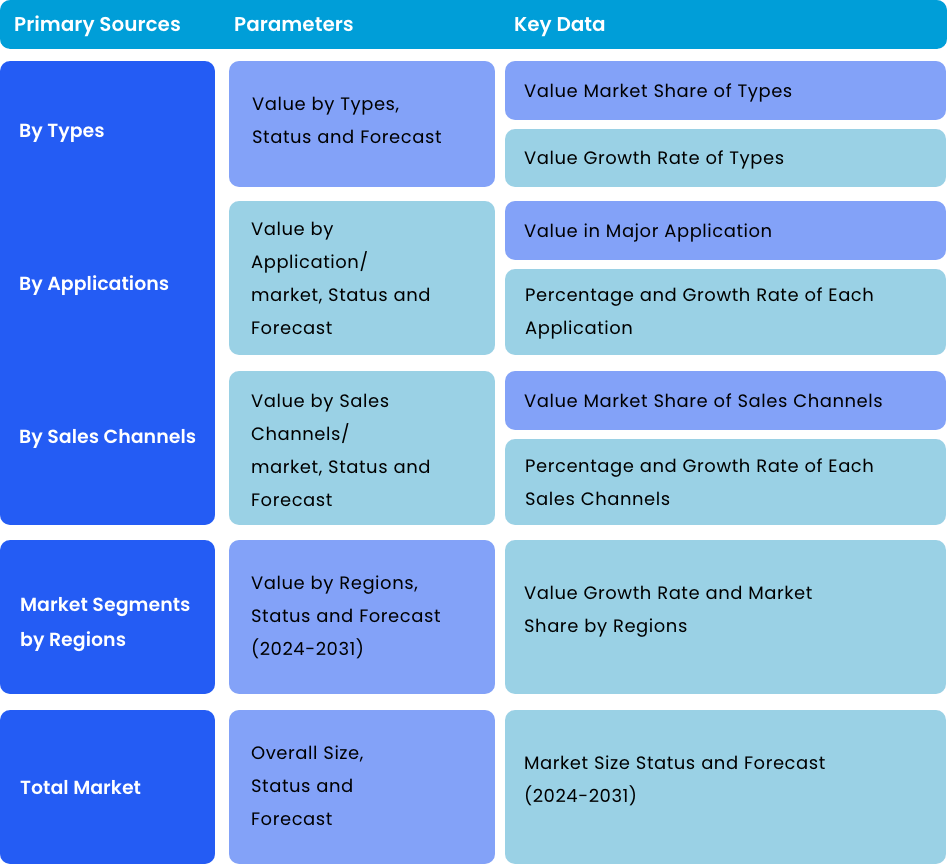
![Key Data Information from Secondary Sources](/wp-content/uploads/2023/04/Secondary-Sources-min.png)
Primary Sources
In the primary research process, various sources from both the supply and demand sides were interviewed to obtain qualitative and quantitative information for this report. The primary sources from the supply side include product Company (and their competitors), opinion leaders, industry experts, research institutions, distributors, dealer and traders, as well as the raw materials suppliers and producers etc.
The primary sources from the demand side include industry experts such as business leaders, marketing and sales directors, technology and innovation directors, supply chain executive, market (product buyers), and related key executives from various key companies and organizations operating in the global market.
Primary research was conducted to identify segmentation types, product price range, product Application, key Company, raw materials supply and the downstream demand, industry status and outlook, and key market dynamics such as risks, influence factors, opportunities, market barriers, industry trends, and key player strategies.
Table Key Data Information from Primary Sources
![Key Data Information from Primary Sources](/wp-content/uploads/2024/01/Primary-Sources-2024-marketsglob-min.png)
Please share youre basic details, to recieve the report sample
![gdpr](/wp-content/uploads/2024/02/GDPR.png)
![ccpa](/wp-content/uploads/2024/02/CCPA.png)
We are GDPR and CCPA compliant! Your transaction & personal information is protected from unauthorized use.